

Research Sources to Scientific Figures
Upload papers, paste notes, or start from a topic and turn methods, results, mechanisms, and findings into clear figure drafts.
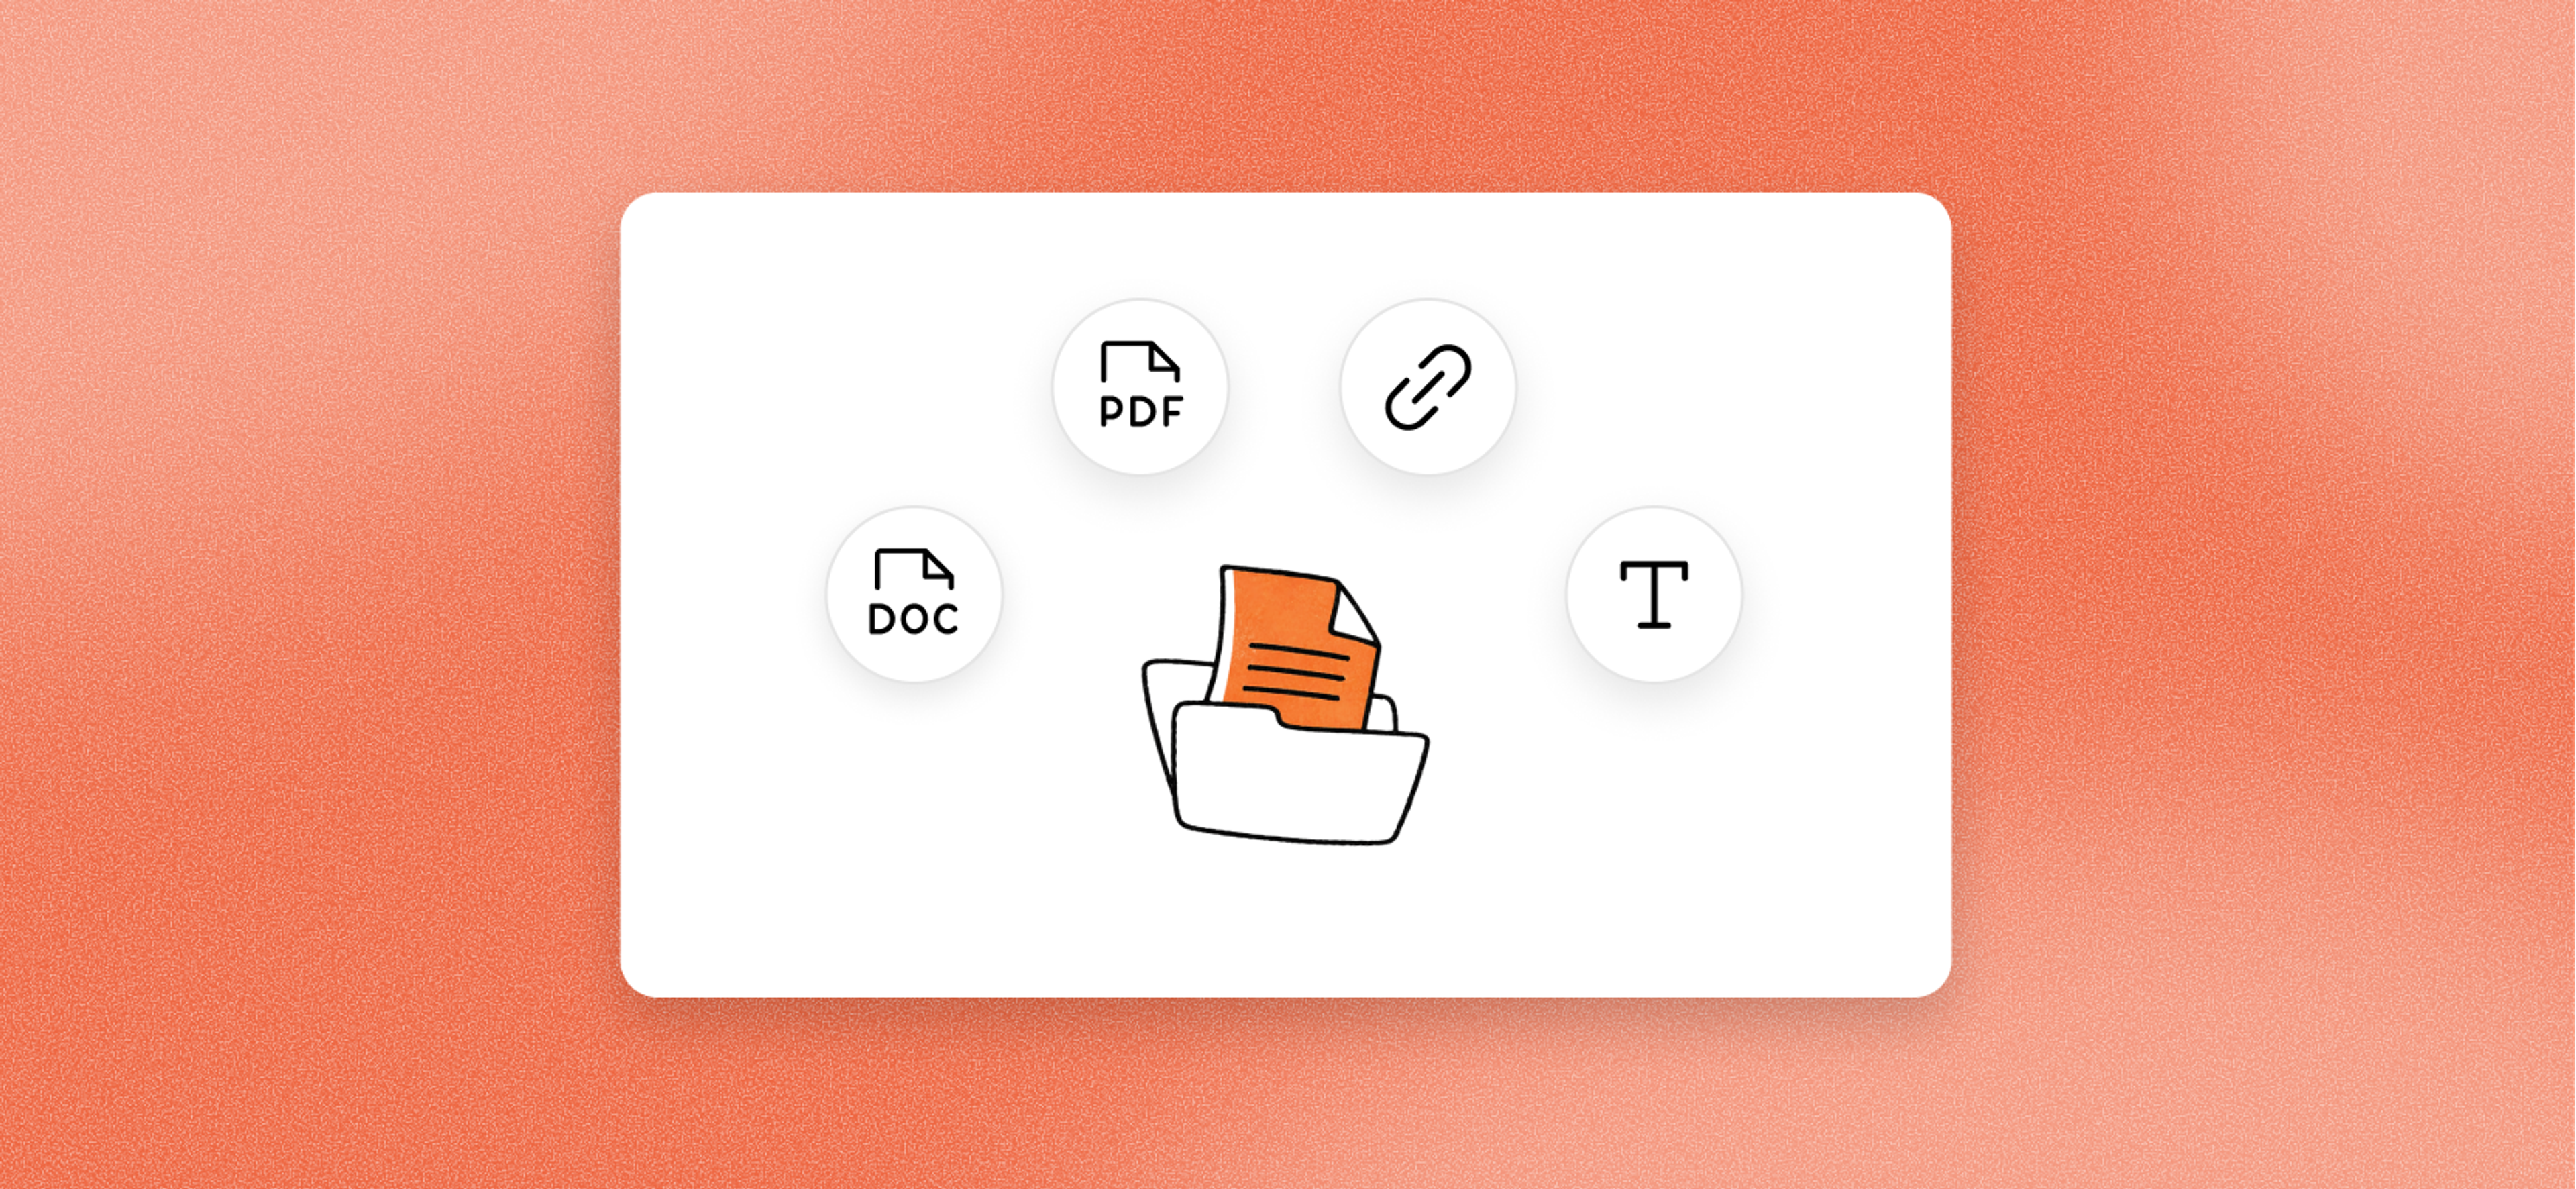
AI scientific figure maker. Generate hi-res PNG/JPG and export editable slides.
Drag and drop your paper, lab notes, lesson material, or document here or
An AI scientific figure maker turns research sources into labeled visual figures with panels, callouts, captions, and readable hierarchy. Use it for papers, posters, lectures, lab reports, and science communication.
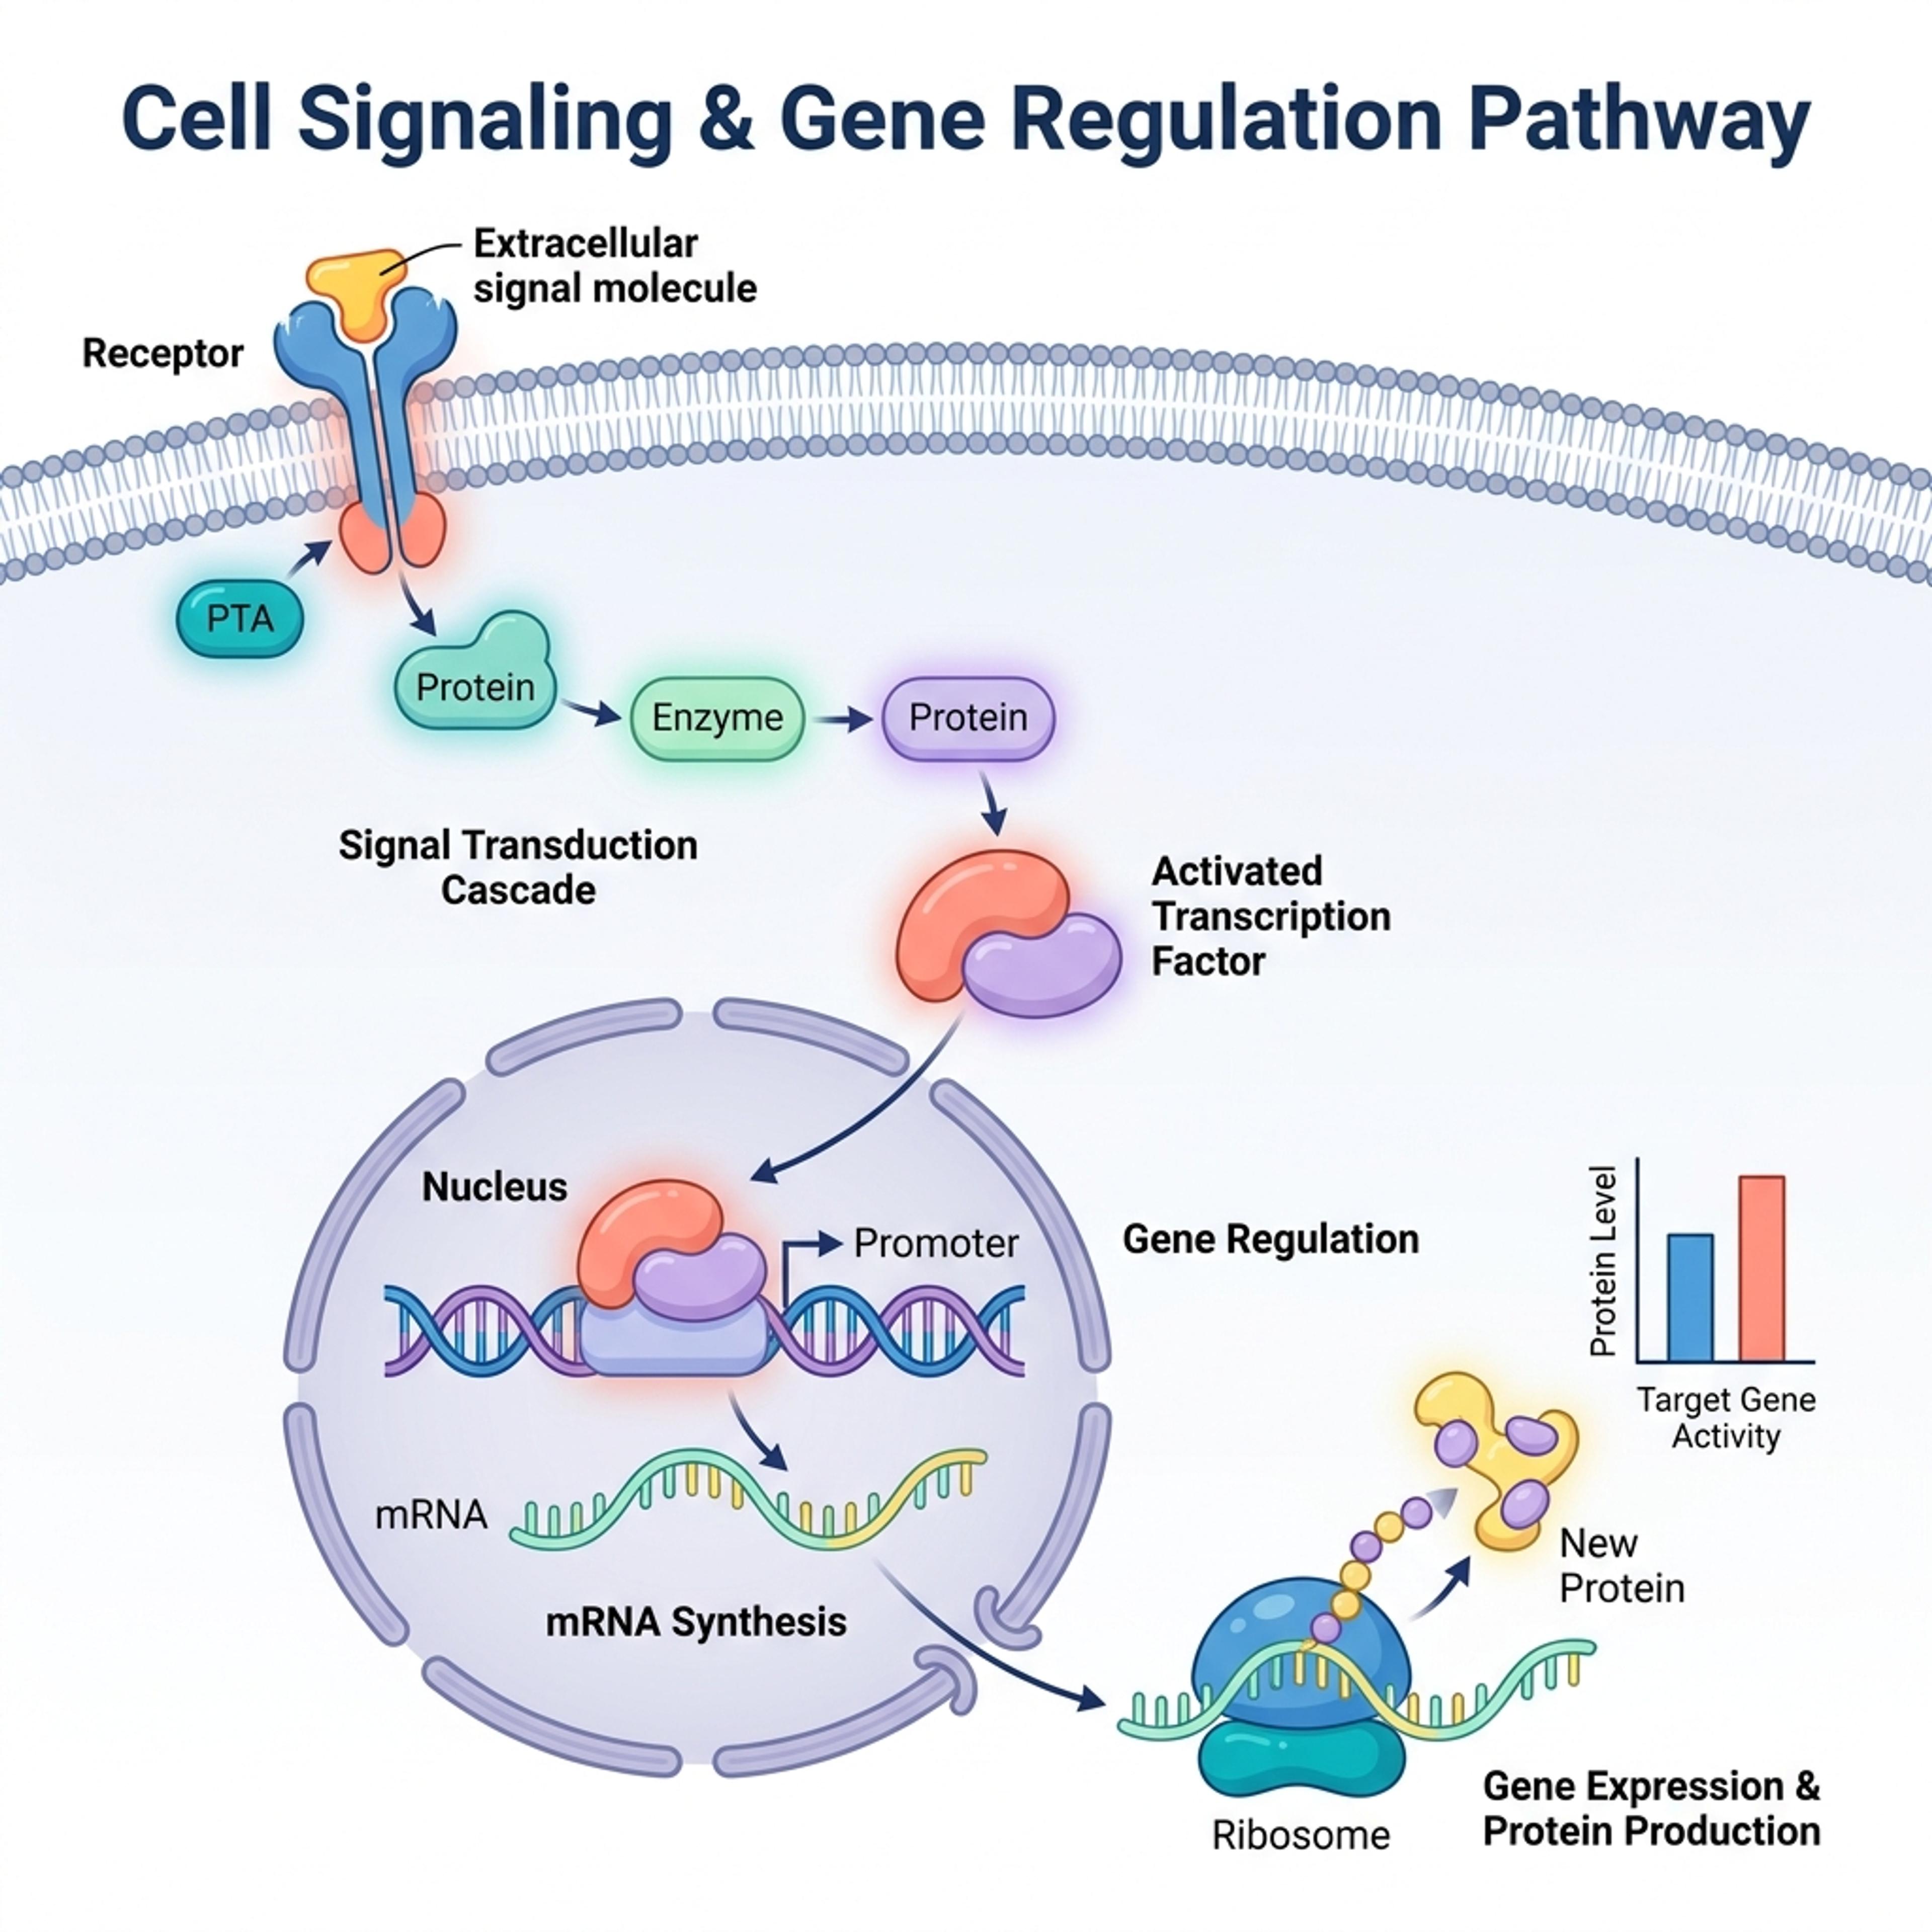
Explore publication-style examples for biology, medicine, graphical abstracts, research workflows, and classroom science.
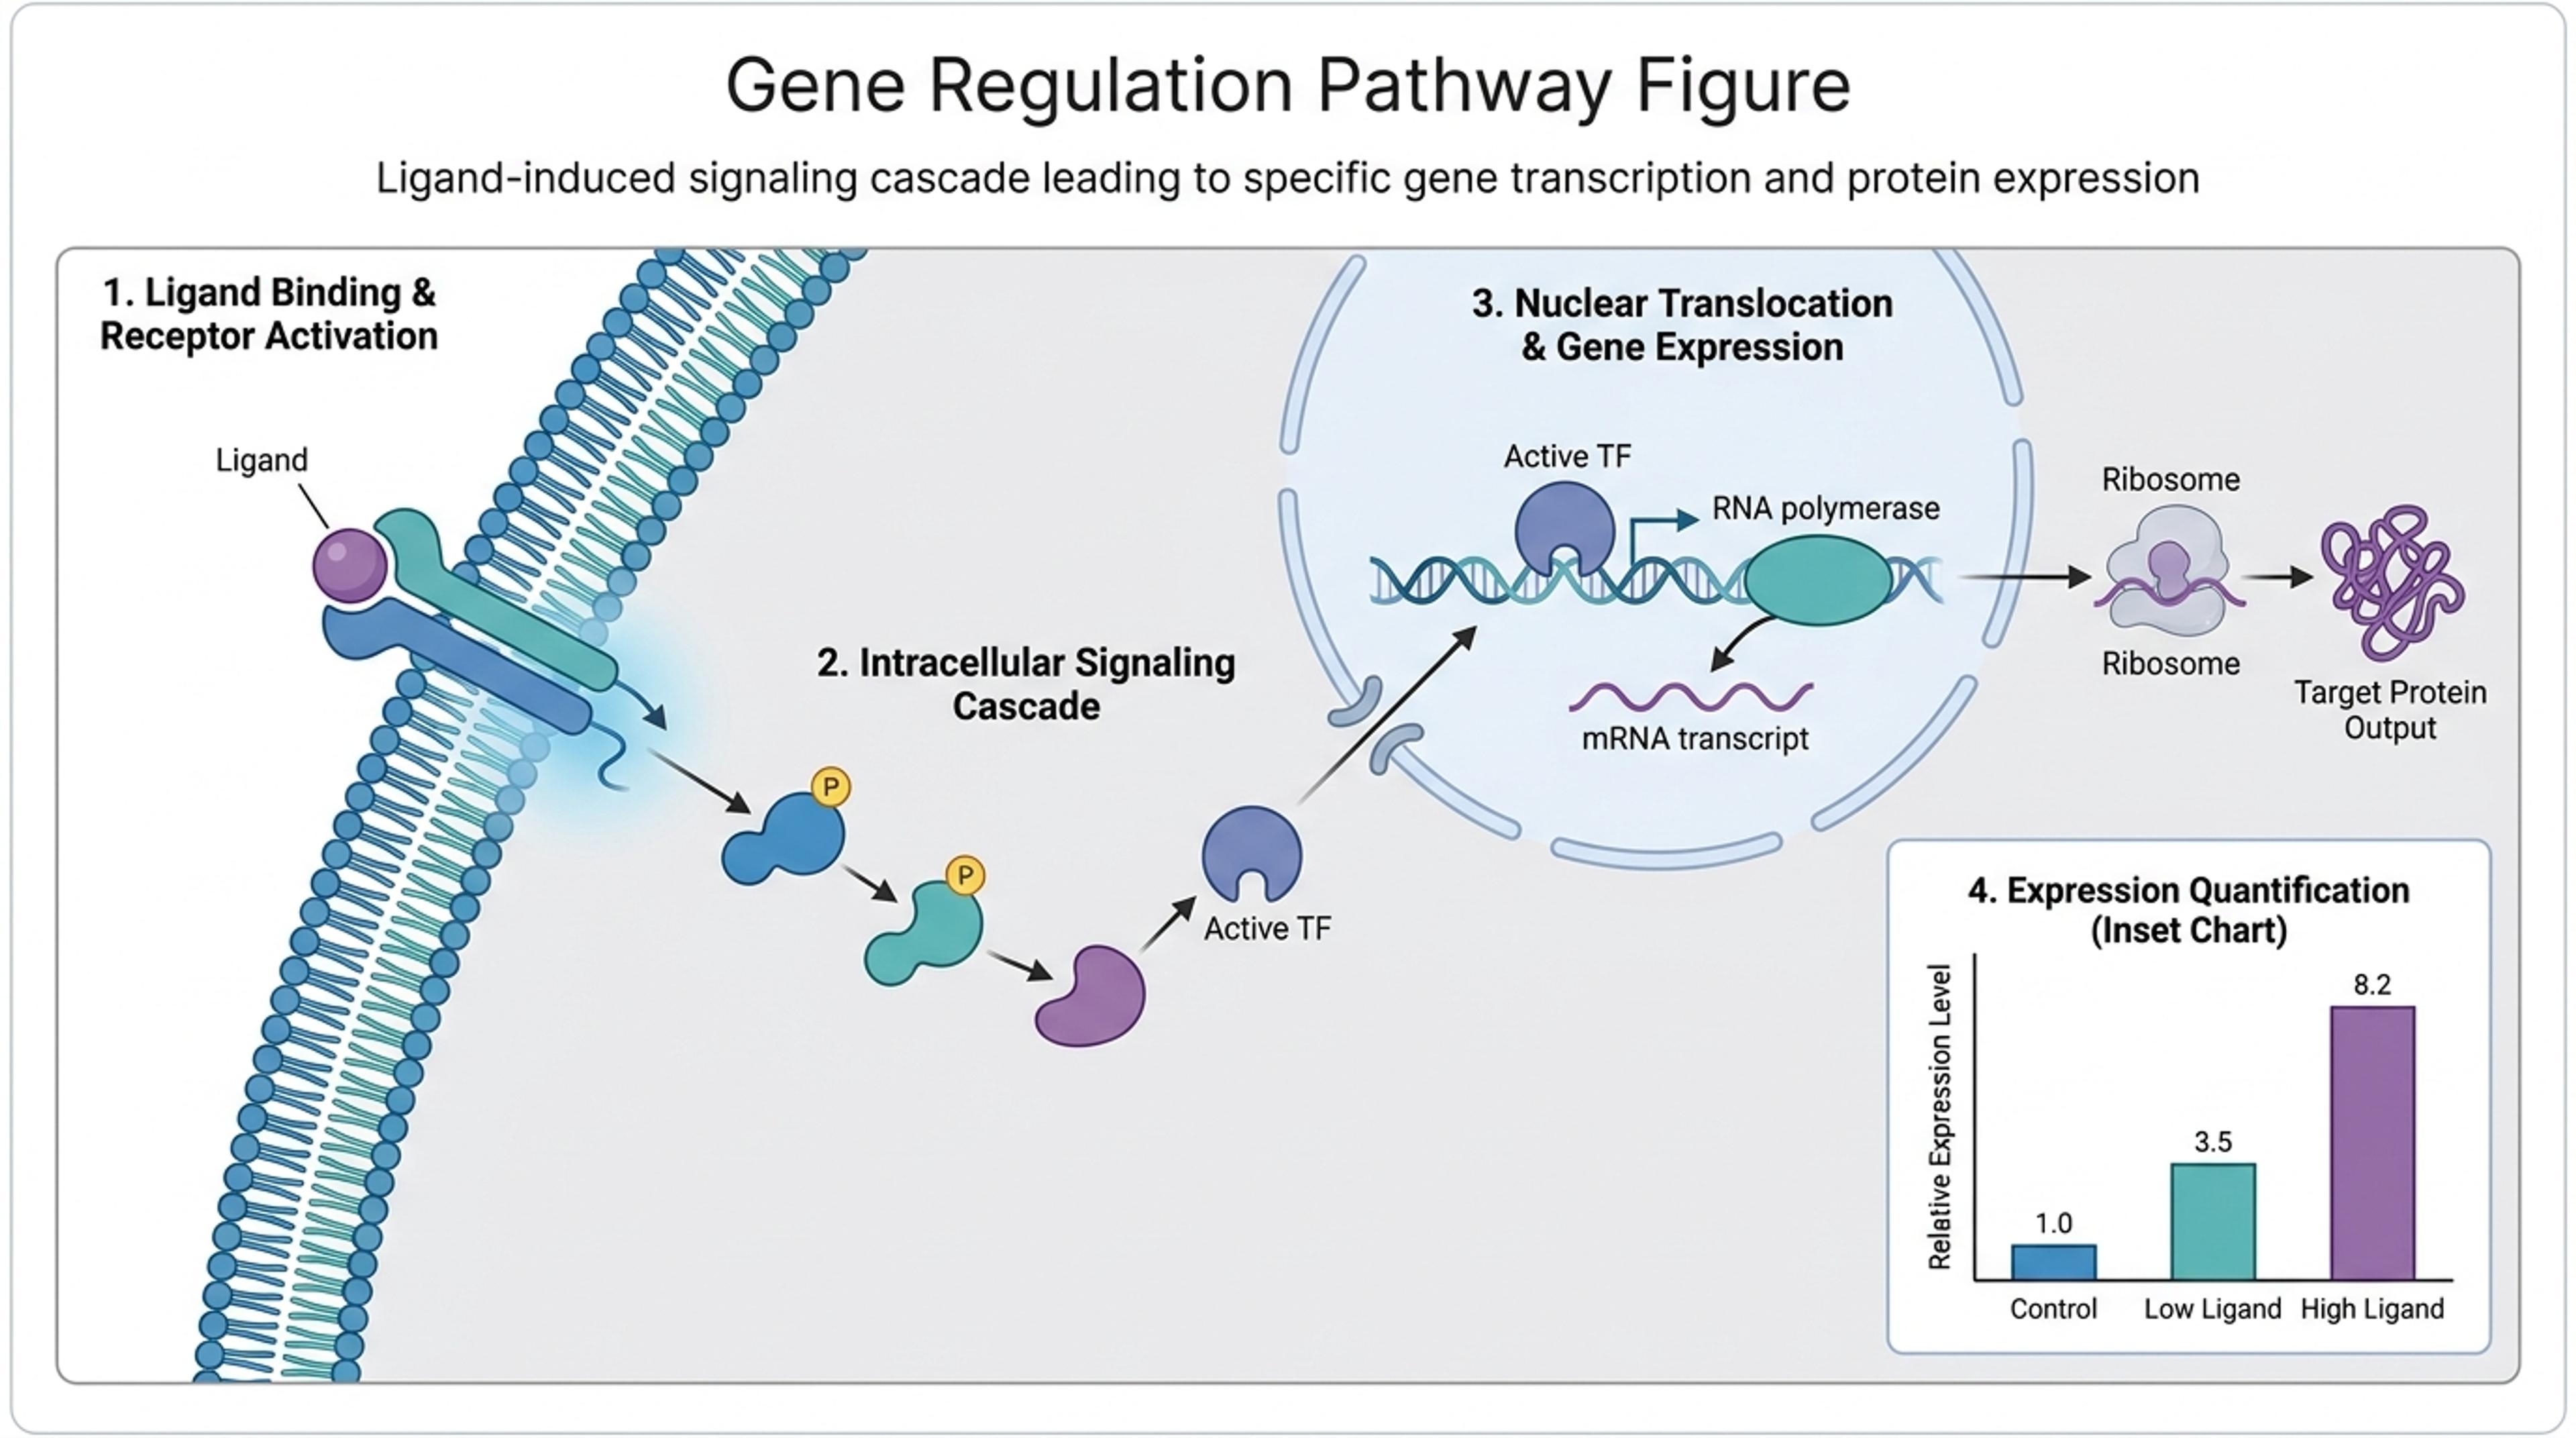
Show ligand binding, signaling cascade, nuclear response, transcription, and protein expression in one labeled figure.
Start from papers, lesson material, lab notes, data, or source content and turn complex science into visuals that read clearly.
Upload papers, paste notes, or start from a topic and turn methods, results, mechanisms, and findings into clear figure drafts.
Create visuals for papers, posters, lectures, lab reports, K-12 lessons, and science communication without rebuilding layouts by hand.
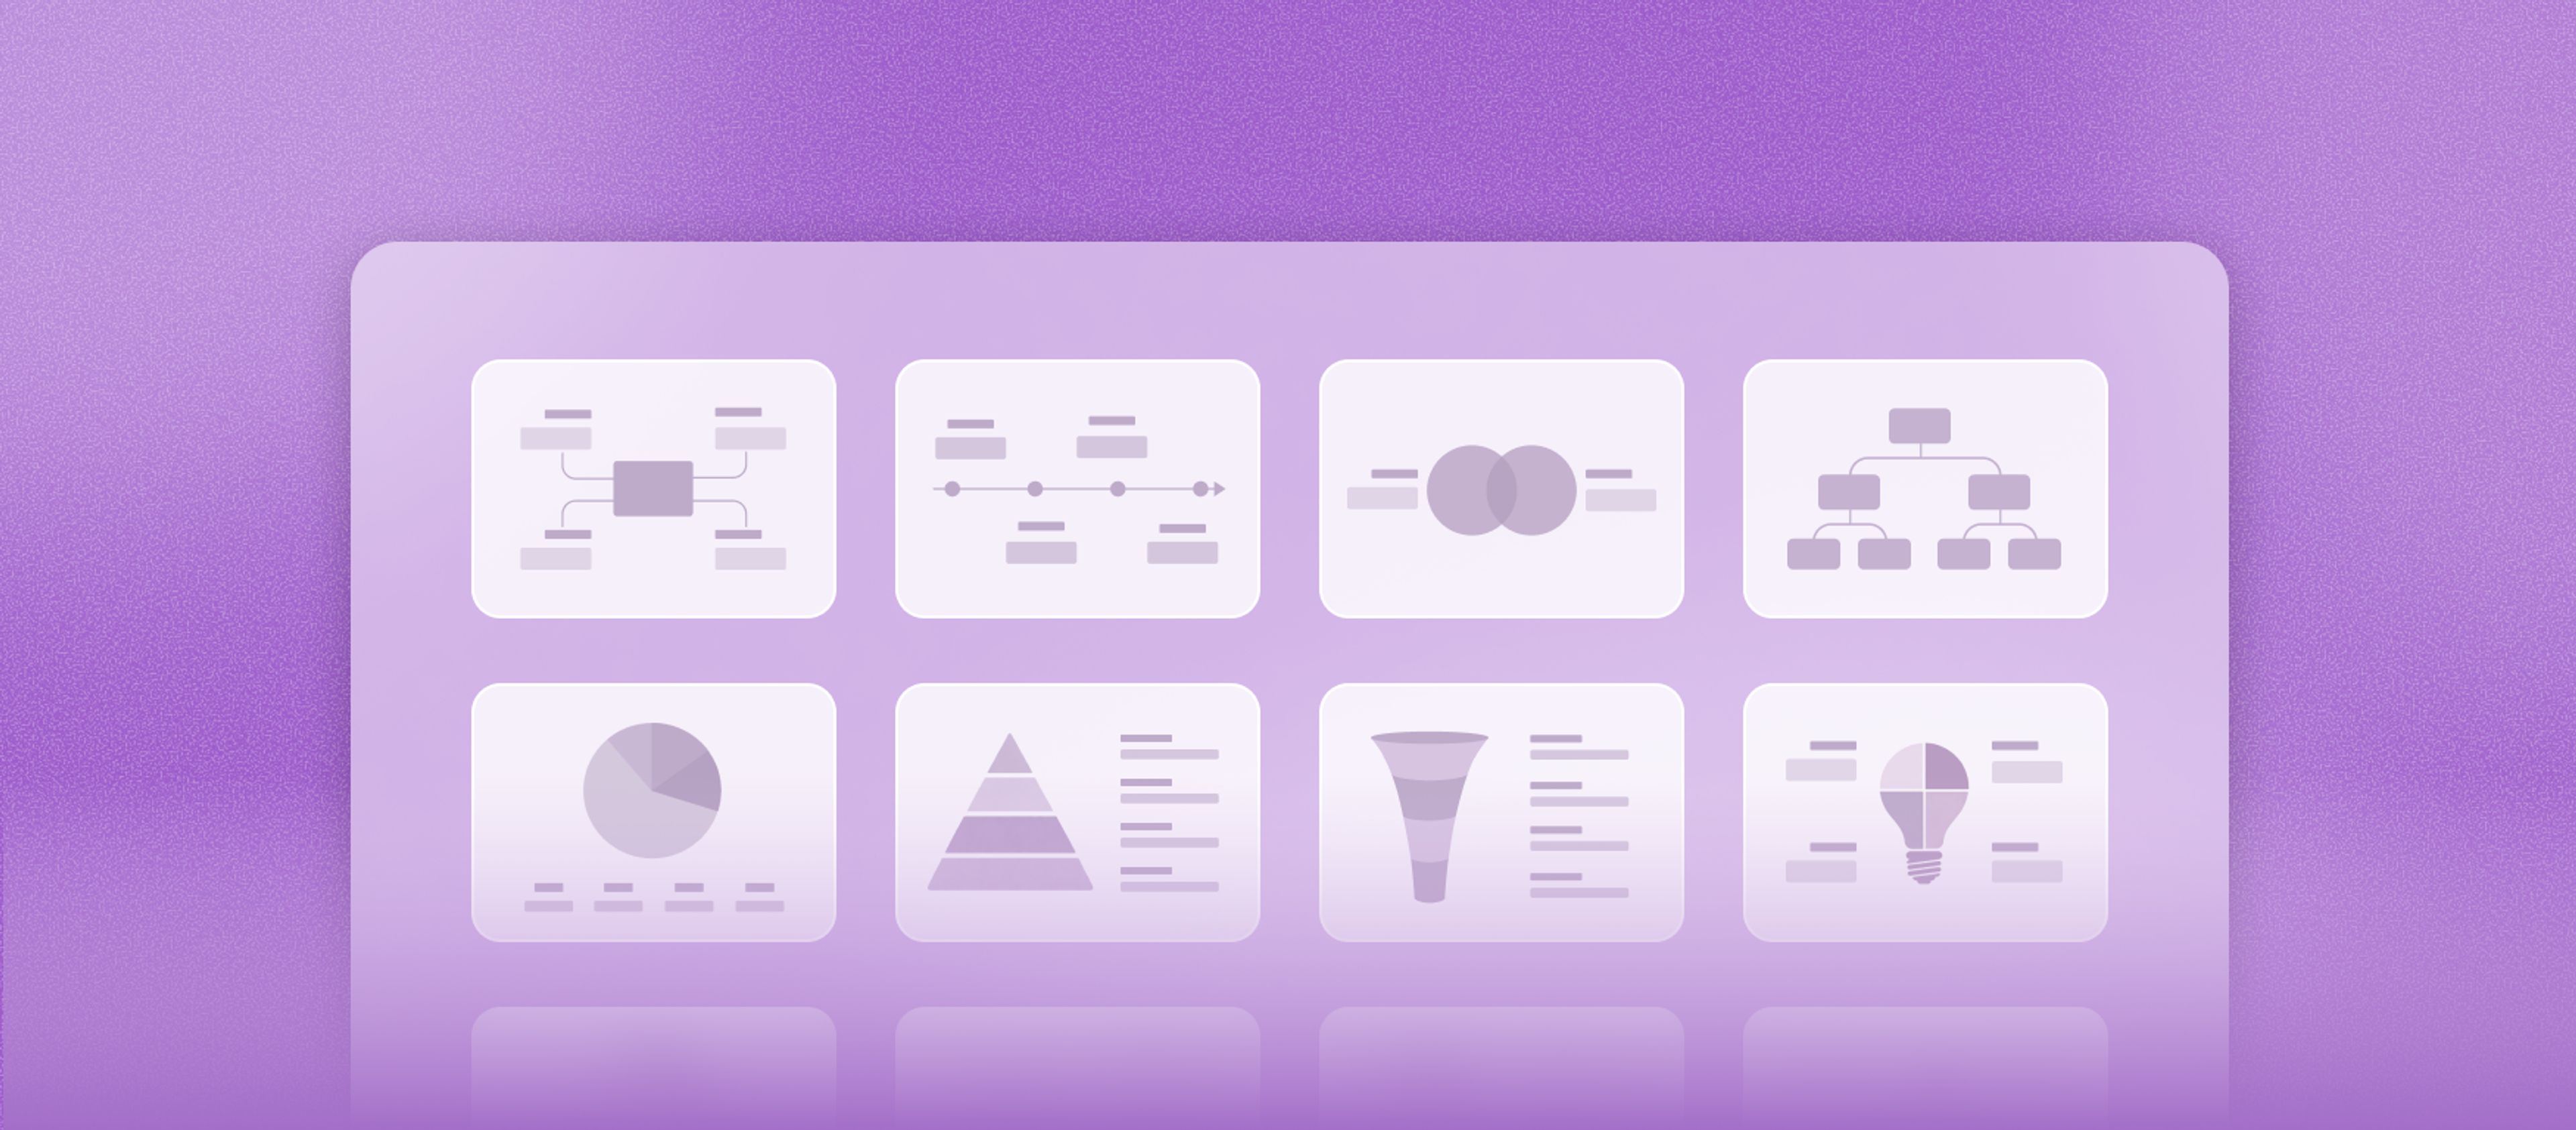
Use timelines, flowcharts, Venn diagrams, concept maps, and research infographics to make complex information easier to scan.
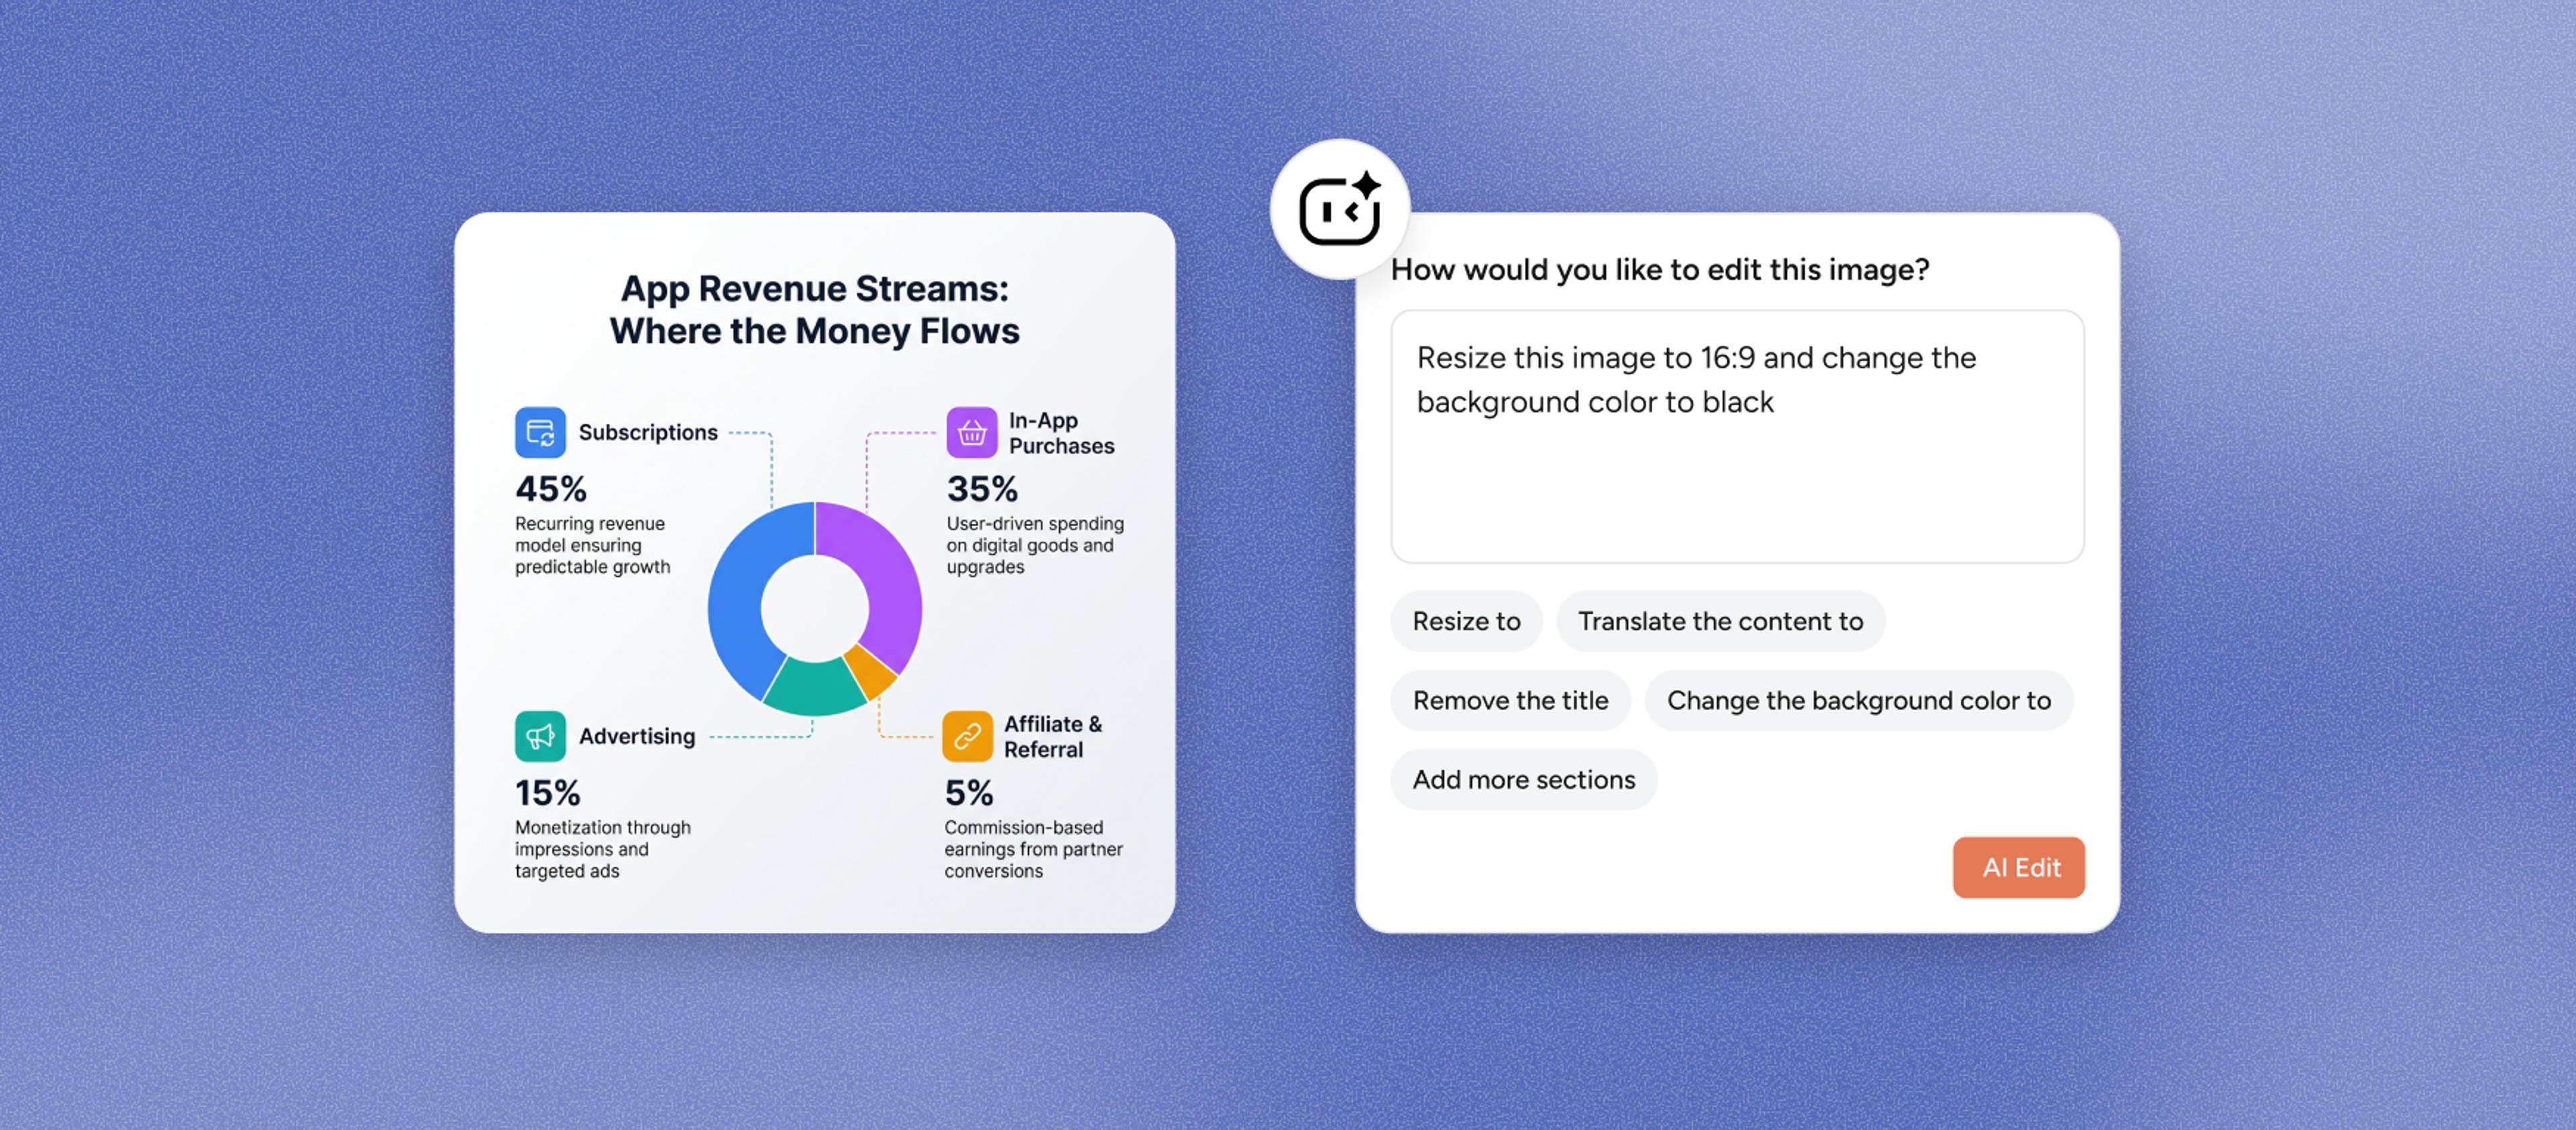
Infograph.me is positioned around AI scientific figures first, with general infographic formats used as supporting traffic and workflows.
Start from papers, documents, links, text, tables, or topics instead of a blank canvas.
Prioritize scientific figures, graphical abstracts, biology diagrams, and research infographics.
Adapt visuals for K-12 teachers, university courses, lab reports, and public science explainers.
Create panels, labels, callouts, captions, and visual hierarchy suited to research communication.
Generate flowcharts, timelines, concept maps, Venn diagrams, and other explanatory visuals.
Ask for clearer labels, simpler wording, new sections, or a different layout after generation.
Design around clean text, labels, and information hierarchy instead of decorative templates.
Download visuals as PNG, JPG, or PDF for reports, slides, learning material, and publishing workflows.
Support research teams, educators, students, biotech communicators, and technical writers.
Infograph.me is an AI scientific figure maker for researchers, educators, students, and science communicators. It still supports general infographics, but the core positioning is scientific figures and research visuals.
Yes. Teachers can turn lesson text, concepts, timelines, biology topics, and classroom material into diagrams and science infographics students can understand quickly.
Yes. You can use source material from papers, notes, links, or topics to create graphical abstracts, research infographics, methods visuals, and study summary figures.
Yes. Those visual formats are still part of the product and now support the science and education workflows around research explanation.
You can export generated visuals as PNG, JPG, or PDF and use them in slides, reports, teaching materials, and documentation.
Start with the core science pages, then use diagram and infographic formats to capture adjacent search demand.
Turn research notes, methods, data, and science topics into labeled scientific figure drafts with AI.
Generate clear scientific illustrations, concept diagrams, and explanation visuals from text, papers, links, and topics.
Create graphical abstract drafts from papers, abstracts, methods, findings, and research notes.
Turn research findings, methods, literature notes, and data into clear academic infographics.
Generate biology diagrams from topics, notes, papers, links, and classroom material with AI.
Turn notes, papers, lesson plans, and topics into concept maps that show ideas, links, hierarchy, and relationships.
Create flowcharts from protocols, workflows, lesson material, notes, links, and process descriptions.
Create timelines from notes, papers, lesson plans, links, events, research milestones, and project histories.
Create Venn diagrams from concepts, notes, papers, lesson material, comparisons, and research themes.
Turn notes, papers, lesson plans, and topics into concept maps that show ideas, links, hierarchy, and relationships.
Turn papers, lab notes, links, text, and data into scientific figures, graphical abstracts, biology diagrams, and research visuals. AI Scientific Figure Maker | Built for research and education